
Greenhouse Gas Emissions Comparison
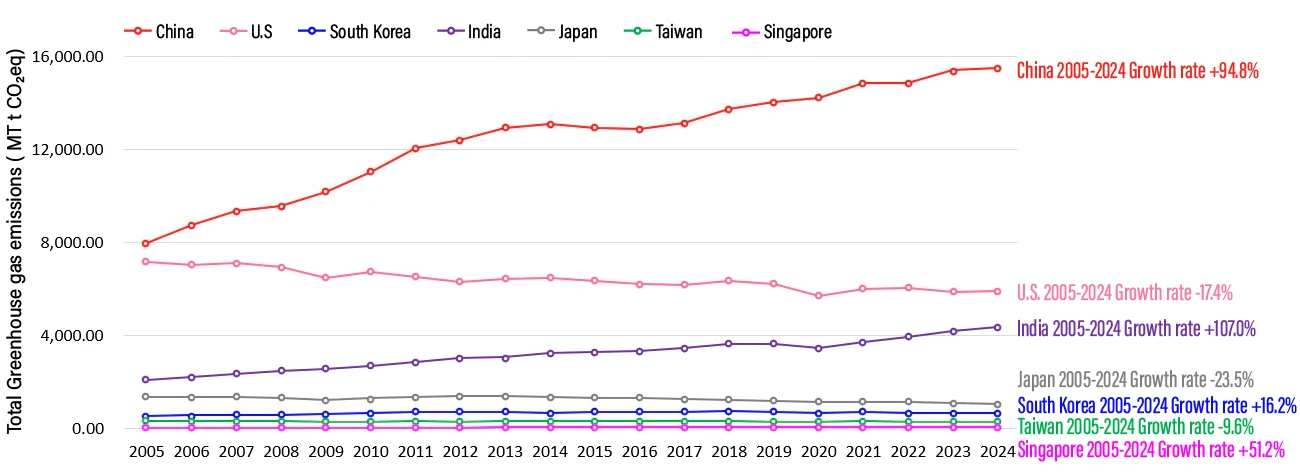
Comparison of Total Greenhouse Gas Emissions by Country
In 2024, among the world’s major greenhouse gas emitting countries, only Japan, South Korea, and Taiwan showed a continued downward trend in total emissions; China, India, the U.S., and Singapore have seen emissions steadily increase from 2005 to the present.
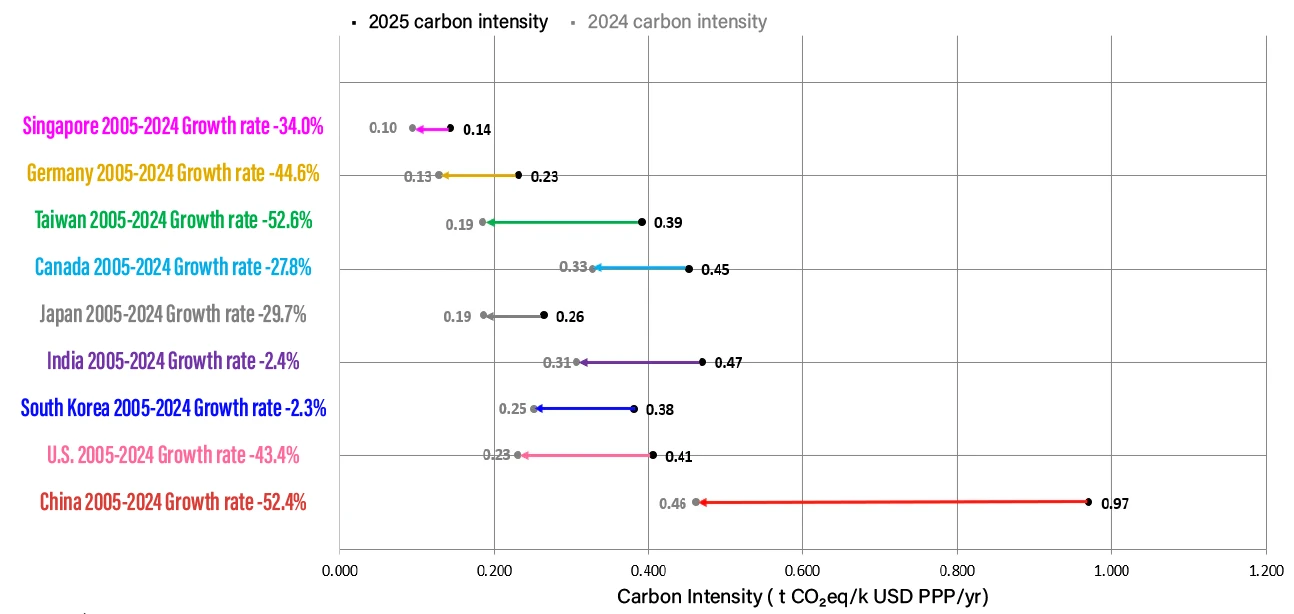
Carbon Intensity by Country: 2005 vs 2024
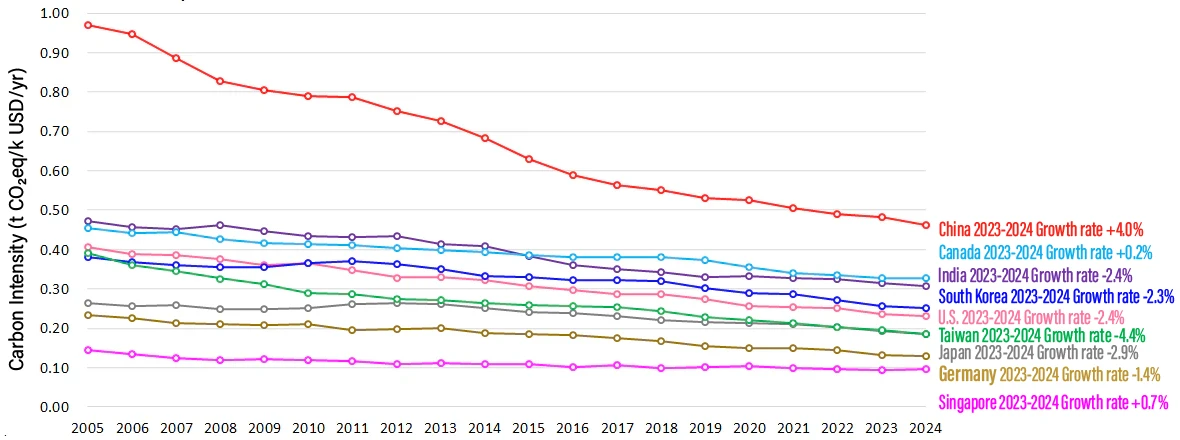
Carbon Intensity by Country: 2023 vs 2024
In 2024, the carbon intensity of major emitting countries declined compared to 2023, with overall levels below 0.5 tCO₂eq/kUSD of GDP. Taiwan’s 2024 carbon intensity was approximately 0.1856 tCO₂eq/kUSD, similar to Japan (0.1861 tCO₂eq/kUSD), and lower than most neighboring Asian countries (e.g., South Korea, China, and India), indicating that Taiwan’s economic growth is increasingly decoupled from emissions.
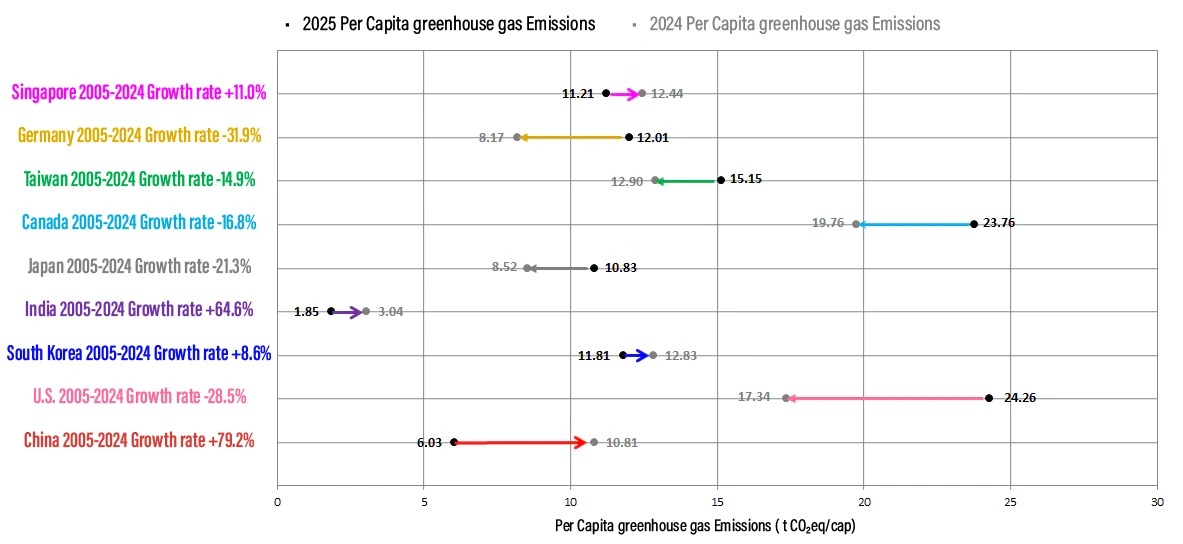
Per Capita greenhouse gas Emissions by Country: 2005 vs 2024
In 2024, the carbon intensity of major greenhouse gas emitting countries declined compared to 2023, with overall levels falling below 0.5 tCO₂eq per thousand USD of GDP. Taiwan’s 2024 carbon intensity was approximately 0.1856 tCO₂eq/kUSD, comparable to Japan (0.1861 tCO₂eq/kUSD) and lower than most neighboring Asian countries (such as South Korea, China, and India), indicating that Taiwan’s economic growth has become increasingly decoupled from carbon emissions.
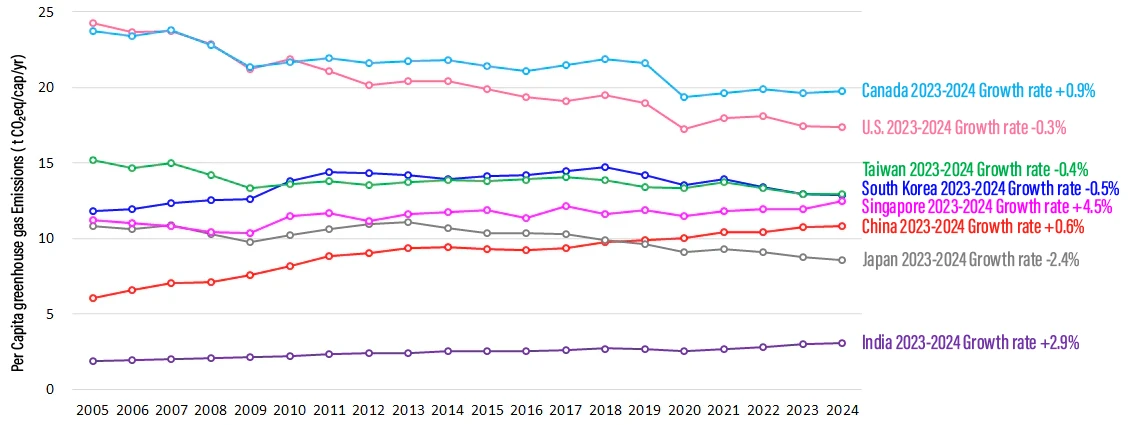
Per Capita greenhouse gas Emissions by Country: 2023 vs 2024
Although China and India have lower per capita GHG emissions than other countries, 2024 levels generally increased compared to 2023. Taiwan’s per capita greenhouse gas emission in 2024 is approximately 12.90 tCO₂eq/cap/yr, similar to South Korea and Singapore, reflecting a 0.4% reduction from 2023, while Singapore’s per capita greenhouse gas emissions increased by 4.5%.
- Data Source: Climate Change Administration
- Publish Date:2025-11-10
- Update Date: 2025-11-10